Financial Information
Miranda Global Research / Vector
2026
2025
2024
2023
2022

Médica Sur – 4Q22 Results

Médica Sur - Resultados 3T22
Médica Sur – 2Q22 Results
Médica Sur – Resultados 1T22
Médica Sur – HR Ratings sube calificación
Médica Sur – Cancelación acciones nombramientos
Médica Sur – Dividendo 2022
Médica Sur - Pagará dividendo en efectivo de P$2.21/acción con rendimiento del 4.4%; crea reserva de recompra de P$500 millones.
Médica Sur - Raising Target Price to MXN$60.00/Share
2021
2020
2019
Financial Highlights
Revenue
Operating Income
Net Income
EBITDA**
**EBITDA = Earnings before interest, taxes, depreciation and amortization
| Millions of pesos | 1Q26 | 2025 | 2024 | 2023 | 2022 | 2021 | 2020 | 2019 | |||
|---|---|---|---|---|---|---|---|---|---|---|---|
| Income Statement | |||||||||||
| Revenue | 1,194.7 | 4,788.90 | 4,402.8 | 4,129.8 | 3,867.9 | 3,906.1 | 3,193.6 | 2,747.8 | |||
| Gross Income | 425.1 | 1,716.20 | 1,491.7 | 1,458.0 | 1,367.2 | 1,535.1 | 1,206.2 | 908.8 | |||
| Operating Income | 191.3 | 802.40 | 568.2 | 727.4 | 574.4 | 661.6 | 602.3 | 382.5 | |||
| Net Income | 134.5 | 540.20 | 461.5 | 635.0 | 949.8 | 1,154.5 | 558.9 | 140.6 | |||
| EBITDA** | 24.2 | 889.00 | 806.2 | 1,009.3 | 1,399.4 | 1,831.4 | 1,255.3 | 714.6 | |||
| Balance Sheet | |||||||||||
| Total Assets | 4,956.5 | 18,850.20 | 4,411.2 | 4,128.1 | 4,576.4 | 6,984.0 | 6,279.2 | 5,846.8 | |||
| Current Assets | 2,077.0 | 7,390.00 | 1,558.2 | 1,272.1 | 1,685.0 | 4,133.1 | 1,618.2 | 1,043.2 | |||
| Non-Current Assets | 2,879.4 | 11,460.30 | 2,853.0 | 2,856.0 | 2,891.3 | 2,850.9 | 4,660.9 | 4,803.6 | |||
| Total Liabilities | 2,299.3 | 18,850.20 | 2,067.2 | 2,090.9 | 2,054.1 | 2,069.7 | 2,270.3 | 2,164.3 | |||
| Short Term | 1,231.9 | 6,543.60 | 2,002.0 | 1,039.5 | 997.3 | 1,003.8 | 963.7 | 963.6 | |||
| Long Term | 1,067.4 | 2,268.70 | 65.2 | 1,051.4 | 1,056.8 | 1,065.9 | 1,306.6 | 1,200.7 | |||
| Shareholders’ Equity | 2,657.2 | 10,038.10 | 2,344.0 | 2.037.2 | 2,522.3 | 4,914.3 | 4,008.9 | 3,682.5 | |||
| ROE | 5.1% | 0.22 | 19.69% | 31.20% | 37.7% | 23.5 % | 13.9% | 3.8% | |||
| Share | |||||||||||
| Closing Price | 60.00 | 60 | 34.00 | 40.63 | 37.20 | 48.7 | 33.6 | 21.5 | |||
| Shares Outstanding | 91,327,317.00 | 91,327,317.00 | 95,404,837 | 95,739,768 | 106,574,875 | 123,281,750 | 123,281,750 | 123,281,750 | |||
| Figures in millions of pesos
** EBITDA = Earnings before interest, taxes, depreciation and amortization. * The 2019, 2020, 2021 results include the effects of IFRS 16 * Audited Figures of 2019, 2020 and 2021 are from Médica Sur and Subsidiaries, discontinued operations have been separated to facilitate reading. EBITDA and Net Income do contain the effect of discontinued operations. * All the financial information presented was prepared in accordance with IFRS (international financial reporting standards). |
|||||||||||
| 09-informacion-financiera | |||||||||||
Reporting Center
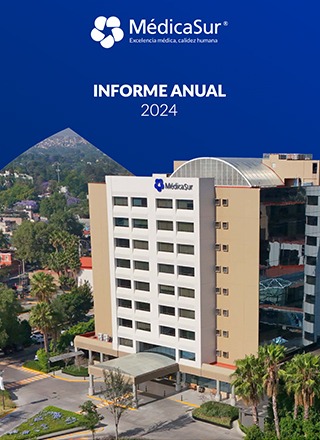 Annual Report 2024
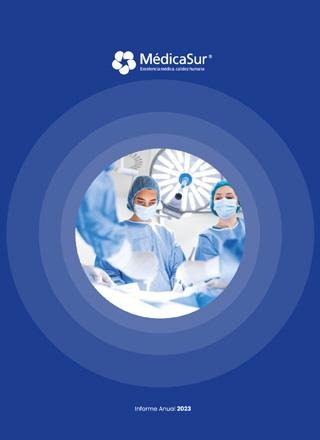 Annual Report 2023
 Annual Report 2022
 Annual Report 2021
 Annual Report 2020
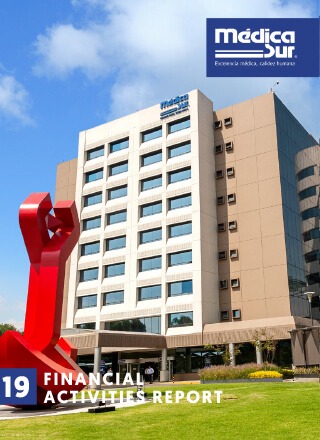 Annual Report 2019
 Annual Report 2018
 Annual Report 2017
 Annual Report 2016
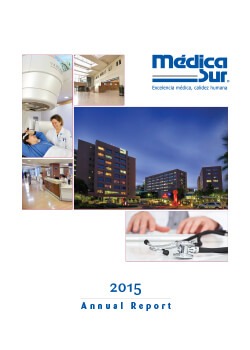 Annual Report 2015
 Annual Report 2014
 Annual Report 2013
 Annual Report 2012
 Annual Report 2011
 Annual Report 2010
 Annual Report 2009